Skip to content

An intelligent data analytics platform for greener, leaner, and more profitable pipeline operations.

Klarian’s Juno transforms raw operational data into real-time decisions

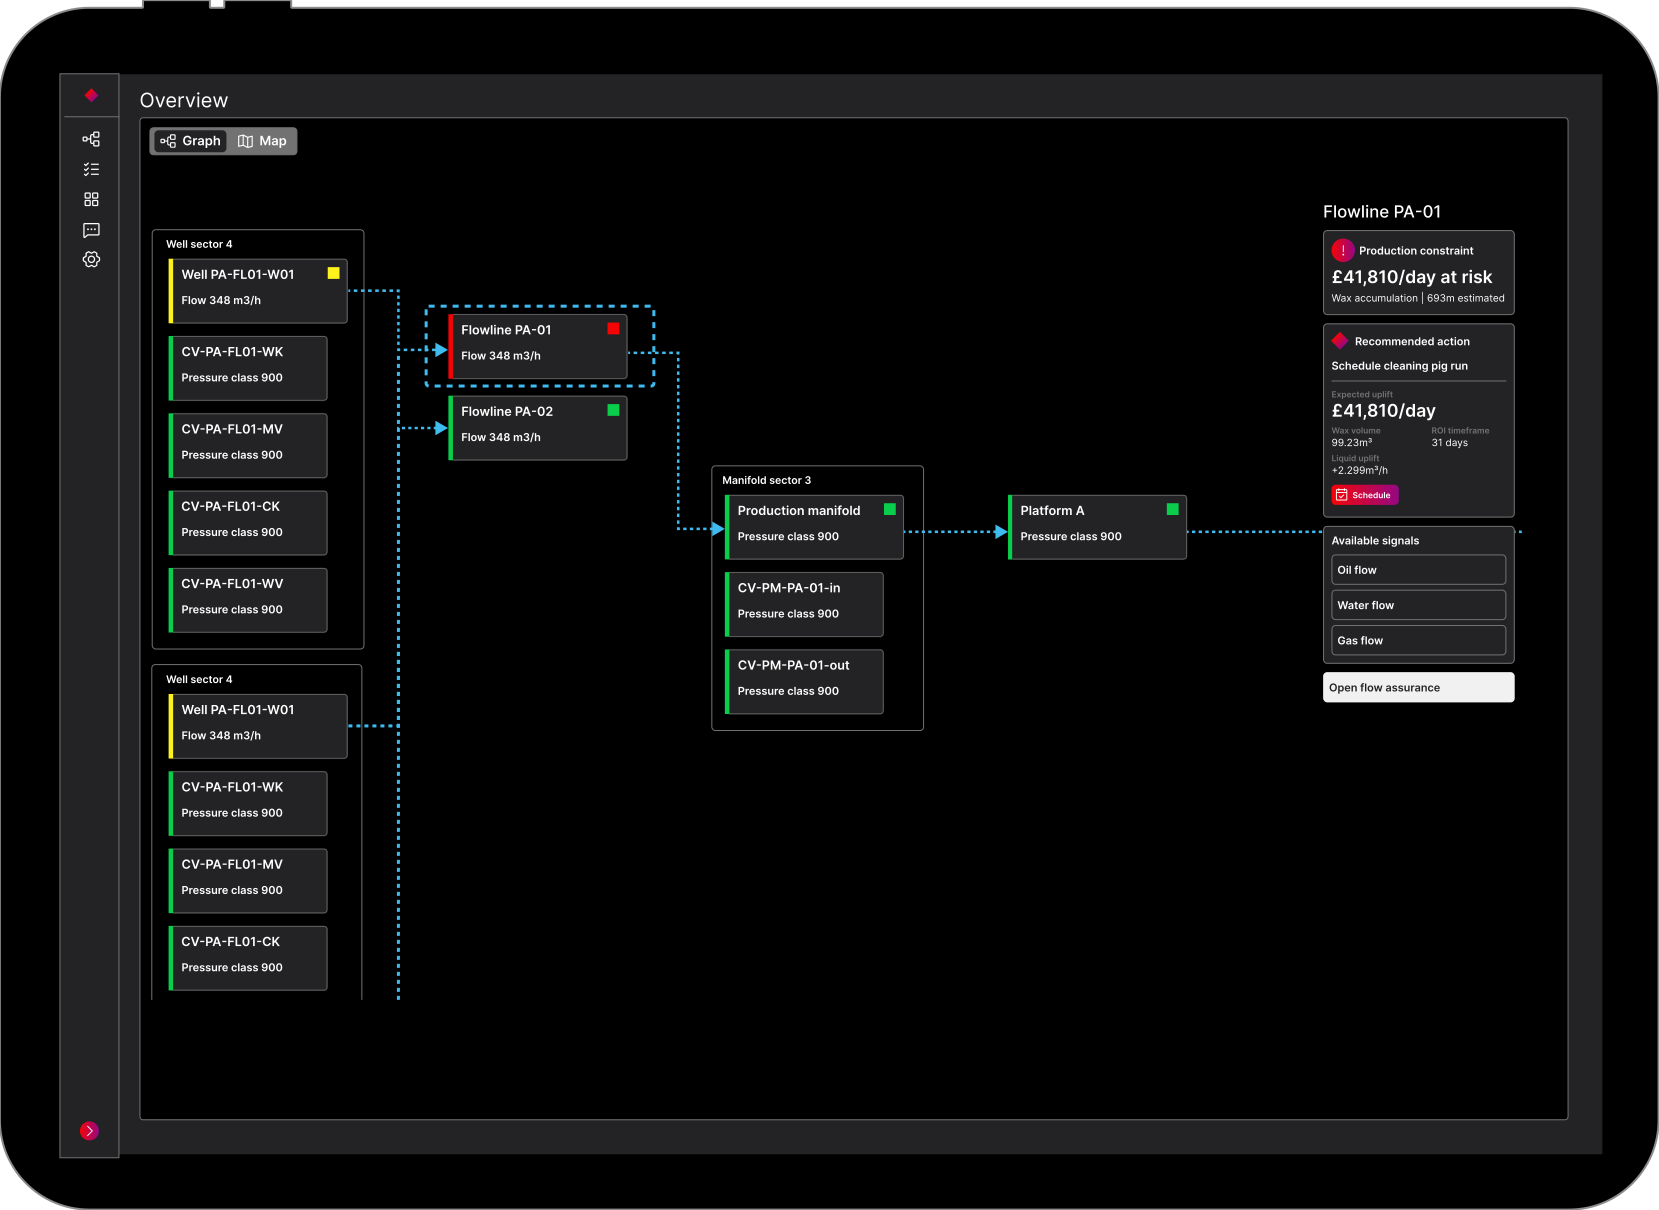
Built using Klarian’s Ontology framework, Juno maps every data point across your network into a knowledge graph, revealing how assets, sensors and systems influence one another.

That means decisions aren’t made in isolation. Juno adds critical context, understanding cause and consequence, so teams can prioritise what matters most. If two alarms trigger at once, Juno's knowledge graph helps identify which failure poses the greatest operational or environmental risk, guiding engineers to act where it counts. By turning complex system data into explainable, context-rich insight, Juno enables faster, more confident decisions that keep flow optimised, downtime reduced and resources focused where they deliver the most value.

Juno platform graphic

Juno gives you total operational oversight

That means decisions aren’t made in isolation. Juno adds critical context, understanding cause and consequence, so teams can prioritise what matters most.

If two alarms trigger at once, Juno's knowledge graph helps identify which failure poses the greatest operational or environmental risk, guiding engineers to act where it counts.

By turning complex system data into explainable, context-rich insight, Juno enables faster, more confident decisions that keep flow optimised, downtime reduced and resources focused where they deliver the most value.

Pipeline under pressure

Not just a pipe dream

Pipelines fuel our world. As demand grows and infrastructure ages, the need for sustainable and efficient pipeline operations increases. Klarian has developed Juno, our end-to-end data analytics service, to collect pipeline data and transform it into actionable intelligence.

Insight that drives action

Juno delivers the intelligence to measure, predict and plan without long IT lead times.

Computed efficiency metrics

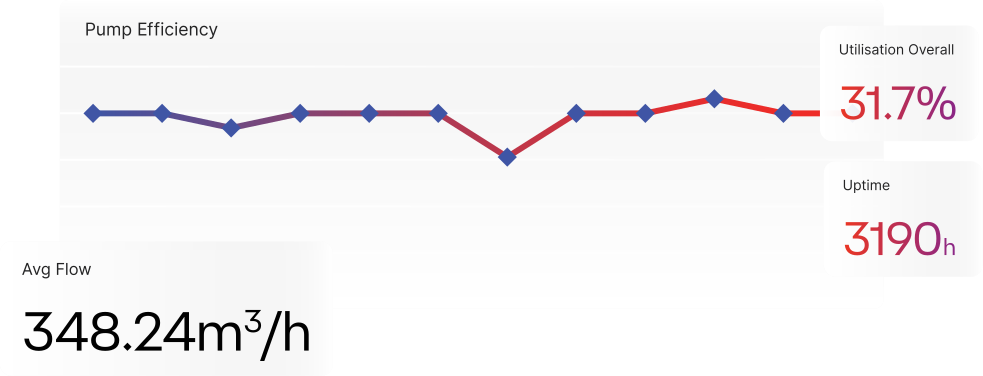
Generates real-time performance calculations across pumps, stations, and pipelines, grounded in the context provided by Juno’s knowledge graph, ensuring every efficiency score reflects real operational conditions.

Virtual sensor insights

Fills data gaps instantly without new hardware, using context-aware models that understand how changes in one part of the system affect the rest.

Predictive risk modelling

Highlights failure risks and maintenance priorities, informed by asset relationships and network dependencies identified through the knowledge graph.

Scenario simulation

Tests the impact of operational choices, from pump scheduling to throughput adjustments, within a model that mirrors your actual system interconnections.

AI-powered diagnostics

Explains past events and predicts future risks through context-driven reasoning, linking symptoms to root causes and consequences across the network.

How Juno works

Using existing sources, Juno connects operational data into a shared system model, accounting for infrastrucutre context and applies analystics to surface trends, benchmarks, anomalies and decision priorities.

All of this is visualised through interactive dashboards, so your teams can explore data, track performance trends and make smarter, faster decisions

Key benefits of Juno

Boost throughout by optimising pump and system performance in context

Cut energy use and emissions through precise efficiency modelling

Minimise downtime with predictive, ontology-informed maintenance alerts

Benchmark performance across assets and eliminate costly inefficiencies

Strengthen collaboration with shared, explainable insights grounded in real-world data relationships

Minimise downtime with predictive, context-informed maintenance alerts

What makes Juno different

Unlike narrow analytics tools or basic SCADA dashboards, Juno is built for infrastructure operations. It combines engineering understanding with live analytics so teams can monitor performance, detect drift and target action with confidence.

Physics-informed models

Rooted in real system dynamics, not statistical guesswork

AI-augmented decision support

Guiding planning and operations with explainable, context-driven insight

Virtual Sensors

Our Virtual Sensors infer critical measurements and reveal unseen system behaviour without additional hardware

Modular design

Built to scale across oil, gas and water networks

Want to see Juno in action?

Juno is already delivering operational and ESG benefits to oil, gas and water clients across the UK.

Contact us to arrange a demo or speak to one of our technical experts.

Juno modules and
integration

Juno is modular and configurable, used on single pumps, full multi-product pipelines or large-scale oil, gas and water networks. It integrates seamlessly with Klarian’s Orkus platform for geohazard management, providing a complete view of both operational and physical pipeline risks.

Technical information

Operational

Pump and system efficiency benchmarking

Juno models pump and system performance based on original equipment manufacturer (OEM) specifications and compares it in real time to live SCADA and sensor data. This enables precise benchmarking at both the asset and system level, helping operators identify inefficiencies, mechanical degradation or flow inconsistencies with confidence.

Virtual Sensors for early anomaly detection

Using advanced signal processing and AI, Juno creates "virtual sensors" that infer key system behaviours from existing data. These virtual readings can detect issues like valve sticking, pump cavitation or flow irregularities that might otherwise go unnoticed,without additional hardware installation.

Downtime root cause analysis

Juno automatically identifies unplanned shutdown events and classifies them using historical performance data and pattern recognition algorithms. Operators receive detailed insights into the most likely causes, whether it's asset fatigue, product mismatch, or environmental factors, enabling faster recovery and smarter prevention strategies.

Scenario planning for throughput, cost and maintenance

Juno's simulation tools allow users to test different operational strategies before applying them. Planners can compare routes, pump configurations or shift timings to optimise for specific KPIs like energy cost per unit volume, system throughput or asset degradation over time.

SCADA enrichment and data exploration tools

Juno enhances raw SCADA data by resampling, labelling and layering it with computed metrics such as asset health scores, efficiency drift and anomaly flags. Users can explore the enriched dataset through a flexible dashboard interface, making it easy to build visualisations and run diagnostics across time ranges or asset groups.